

Mark on the Markets
September 2026
The Giants Came Back
In July the market broadened out, and the big technology names rested. In August the script flipped. The giants led again, the average stock quietly slipped, and the indexes still finished higher. Underneath all of it, the conversation about interest rates turned in a direction almost nobody expected six months ago.
Two months, two very different markets, and honestly, both of them healthy. That is worth sitting with for a moment, because it runs against the way most of us are wired. We want a single story that explains everything. Markets rarely cooperate. Stewarding wealth well means holding steady when the leadership changes, and August changed the leadership right back.
A Month That Looked Better Than It Felt
The headline numbers were good. The Nasdaq Composite rose 3.9 percent, snapping two straight monthly declines, as investors returned to the large artificial intelligence names they had been selling all summer. The S&P 500 gained 2.6 percent and touched an all-time high early in the month. The Dow added 1.3 percent. For both the S&P 500 and the Nasdaq, it was the best August since 2021.
Now the part the headlines missed. The S&P 500 Equal Weight Index, which treats every company in the index the same rather than letting a handful of giants dominate, actually fell 1.3 percent in August. Small companies barely moved, with the Russell 2000 up less than 1 percent. Five of the eleven sectors finished the month in the red, led by utilities and industrials. So, the index went up while the average stock drifted down. That is the mirror image of July, when the average stock hit a record and the index went nowhere.
Why July and August Are Both Good News
Last month I wrote that a market whose gains are shared broadly stands on a sturdier foundation than one leaning on five or six names. I still believe that. August does not undo it. What August shows is the other half of the same truth, which is that leadership rotates, and it rotates without asking permission or giving notice.
Consider what it would have cost to act on either month. An investor who sold technology in July, convinced the AI trade was finished, missed a 3.9 percent month. An investor who sold everything else in August, convinced only the giants matter, would be positioned exactly wrong the next time the wheel turns. And through eight months, the average stock is still ahead. Including dividends, the equal-weight S&P 500 has returned roughly 15 percent this year against about 13 percent for the S&P 500 itself. The seven largest companies, as a group, are the ones lagging. You do not have to guess which side leads next. A balanced portfolio owns both sides and lets the rotation happen underneath you.
Profits Are Still Doing the Work
None of this is built on sentiment. Second-quarter earnings finished as one of the strongest seasons in years. With 97 percent of S&P 500 companies reporting, 86 percent beat profit expectations and 77 percent beat on revenue. The earnings growth rate for the quarter came in at 52 percent, the fastest since the recovery quarters of 2021, and all eleven sectors grew revenue. Over time it is profits, not headlines, that hold a market up. This year the profits have shown up.
The Word Coming Back Into the Conversation Is Hike
Here is the development I would want you to walk away with. For most of the past two years the debate was how quickly the Federal Reserve would cut rates. That debate is over. The Fed left its benchmark rate at 3.50 to 3.75 percent in July, but three members voted to raise it, and there was no meeting in August. Then, at the annual Jackson Hole conference in late August, Chairman Kevin Warsh made clear he does not believe underlying inflation has meaningfully improved and that the Fed still has work to do. Markets repriced almost immediately. The odds of an increase at the September 15 and 16 meeting roughly doubled, to somewhere between 55 and 66 percent depending on the day and the measure. A quarter-point move would put the range at 3.75 to 4.00 percent.
The reason is straightforward. Inflation has come down a great deal from its peak, but it has stopped coming down. Consumer prices are running 3.4 percent above a year ago and the Fed’s preferred core measure is at 3.3 percent, both comfortably above the 2 percent target. Energy is a large part of that. Not everyone agrees a hike is coming, and reasonable people at the Fed are arguing both sides. But the direction of the conversation has changed, and that is worth knowing before you read a headline about it.
There is a second piece to this, and it does not run through the Fed at all. The 30-year Treasury bond is a corner of the market almost no individual investor buys, yet it quietly sets the tone for long-term borrowing everywhere, including mortgages. It has now yielded more than 5 percent for the longest stretch since 2006 and ended August above 5.25 percent, roughly a 19-year high. That is not really a Fed story. It reflects the size of the federal deficit and the flood of new bonds needed to finance it, inflation that will not settle, and investors insisting on being paid more to lock up money for thirty years. Treasury Secretary Scott Bessent announced in late August that the government would at least double its bond buybacks beginning September 9 to take some pressure off. The relief lasted about two days before yields climbed right back. When the long end of the bond market will not cooperate, it is usually telling you something the short end is not.
What You Feel at the Pump
This is not only a Wall Street story. Crude oil ended August near $86 a barrel, up about 50 percent this year, as renewed hostilities around the Strait of Hormuz squeezed shipments. Gasoline pushed above $4.00 a gallon nationally, roughly 94 cents higher than a year ago. Energy was the best sector in the market again, up 7 percent for the month and about 44 percent for the year, nearly double any other sector. Gold jumped 9.6 percent in August to around $4,497 an ounce. And here is the number that lands closest to home. Wages are up 3.2 percent over the past year while consumer prices are up 3.4 percent, which means the average paycheck is losing a little ground. When clients tell me the numbers on the news do not match what they see at the pump and the grocery store, they are not imagining it.
One Item Worth Watching
The job market is the piece that keeps my attention. Employment fell by 23,000 in July, and revisions took another 103,000 jobs out of the May and June figures. The unemployment rate ticked down to 4.1 percent, because layoffs remain low and few people are quitting. What we have is a frozen labor market, not a collapsing one. Hardly anyone is being let go, and hardly anyone is being hired. The tension is obvious. The Fed may be preparing to raise rates into a job market that has already stopped growing, and that is the balance I will be watching most closely this fall.
The Volatility I Warned You About, and What Comes Next
Back in the spring I told you to expect a bumpy year. I want to return to that now, because we are walking into the stretch of the calendar where it matters most. This is a midterm election year, and midterm years have historically been the most volatile of the four-year election cycle. The average peak-to-trough decline inside a midterm year runs near 19 percent, against roughly 12 to 13 percent in the other three years. The reason is not complicated. Markets dislike uncertainty, and an election that can change the balance of power in Congress supplies a great deal of it. Election day is November 3.
You could look at an S&P 500 up 12 percent for the year and conclude the volatility never arrived. It arrived. It simply did not arrive where the headlines were pointing. The S&P 500 fell about 8 percent between late February and the end of March as the conflict with Iran escalated. Semiconductor stocks dropped roughly 25 percent in six weeks in early summer. Gold set an all-time high near $5,595 in January, fell below $4,000, and has since clawed most of it back. Oil is up about 50 percent. And market leadership has changed hands twice in the past eight weeks. That is a volatile year by any honest measure. It has just been volatile underneath a calm-looking index.
Here is what has my attention now. Mid-August through mid-October is historically the choppiest stretch of a midterm year, and September is the weakest month on the calendar. In mid-August the VIX, the market’s fear gauge, fell to its lowest reading of 2026, which usually signals complacency rather than safety. One statistic stopped me, because it involves the very index I chart for you every month. In every midterm election year since 1990, the equal-weight S&P 500 has pulled back at least 7 percent from its mid-August level into mid-October. Every single one.
Now the encouraging half, and it is the more important half. Since 1950 the S&P 500 has been higher twelve months after every midterm election without exception, with an average gain in the neighborhood of 15 percent. The stretch from the fourth quarter of a midterm year through the middle of the following year has been the strongest three-quarter run in the entire cycle. So, if the next several weeks turn rough, that is not evidence something has broken. It is the ordinary price of admission in this particular year, and history says it has usually been followed by strength. I am not making a prediction, and I am not repositioning anyone’s portfolio around a calendar. But I would much rather you hear this from me in September than from a frightening headline in October.
What This Means for You
Start with what not to do. Do not chase last month’s leader. The past two months have handed the baton back and forth, and the investor who buys whatever just worked ends up buying high with impressive consistency.
Then look at the rate question from both directions. If the Fed does raise rates, cash and short-term bonds get more attractive, not less, and money market yields would follow the increase up. Longer bonds are the mirror image. The 10-year Treasury already yields about 4.75 percent, up more than half a percentage point this year, and the broad bond market is roughly flat for 2026 as a result. Knowing which of those two you own matters more this year than it has in a long time. And if you carry floating-rate debt, a home equity line, a credit card balance, a business line of credit, this is the month to look at it, because that cost moves the week the Fed does.
Finally, rebalance. After a year like this one, portfolios drift without anyone touching them. Trimming what has run and adding to what has lagged is how you sell high and buy low without predicting a single thing. That is not exciting, and it is not supposed to be. Patient, boring, disciplined stewardship is what compounds.
“Two months, two very different sets of leaders, and one steady portfolio. That is not luck. That is design.”
| Key Index Returns |
|
|
|---|---|---|
|
|
August 2026 % |
YTD % |
|
Dow Jones Industrial Average |
+1.3 |
+10.7 |
|
Nasdaq Composite |
+3.9 |
+13.5 |
|
S&P 500 Index |
+2.6 |
+12.3 |
|
S&P 500 Equal Weight Index ★ |
–1.3 |
+12.8 |
|
Russell 2000 (Small-Cap) Index |
+0.9 |
+19.1 |
|
MSCI World ex-USA** |
+2.8 |
+14.5 |
|
MSCI Emerging Markets** |
+3.4 |
+21.7 |
|
Bloomberg US Agg Total Return |
+0.4 |
–0.2 |
★ The S&P 500 Equal Weight Index is added to the table this month because it is the index I chart on the next page and because it tells the real story of August. It fell 1.3 percent while the S&P 500 rose 2.6 percent, yet it remains ahead of the S&P 500 for the year.
MTD returns: July 31, 2026 to August 31, 2026 | YTD returns: December 31, 2025 to August 31, 2026
** In U.S. dollars, total return. Other returns shown are price returns unless otherwise noted.
Sources: Wall Street Journal Market Data, S&P Dow Jones Indices, MSCI.com, Bloomberg, Nasdaq. U.S. equity index August returns independently confirmed via WSJ Market Data Center. International and bond figures confirmed against preferred data feed prior to publication.
Mark on the Charts
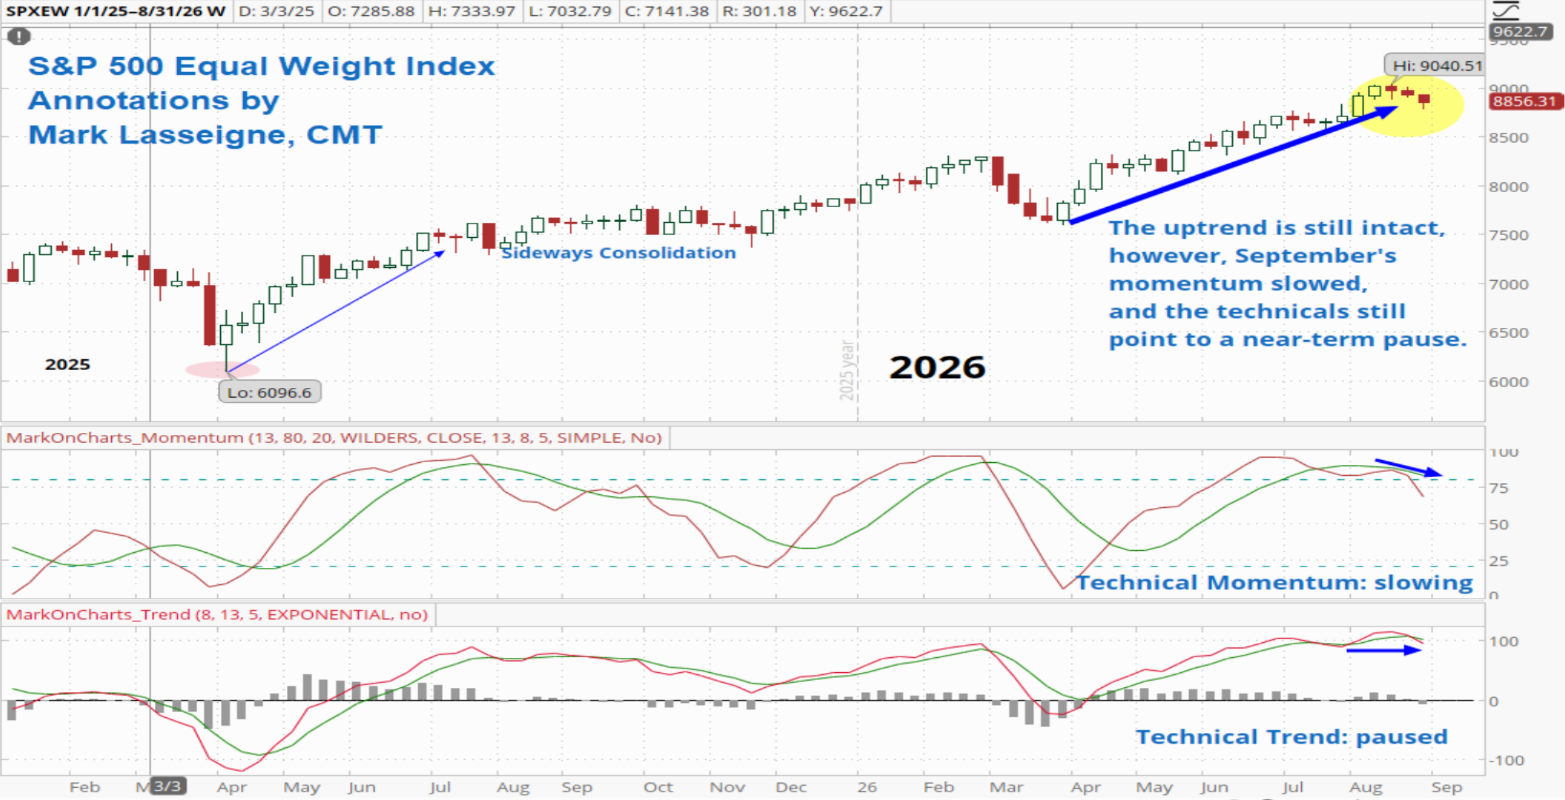
The chart above is the S&P 500 Equal Weight Index, which gives every company in the index the same importance rather than letting the largest few dominate. I follow it because it tells me whether an advance is broad and well supported or narrow and fragile. Last month I wrote that it looked due for a rest. August delivered exactly that.
The pause arrived, and it was a mild one. After setting a record near 8,835 in July, the index spent August drifting rather than falling and closed the month near 8,760, down about 1.3 percent and roughly one percent below its high. That is not a correction. That is a market catching its breath.
The primary trend is unchanged and still firmly higher. From the early 2025 low near 6,097, the pattern of higher highs and higher lows remains intact, and nothing in August threatened it. My momentum indicator has flattened but has not rolled over, and my trend model remains positive even though it is no longer leading the advance.
So my read has not changed much. The uptrend is intact and I remain constructive on the broad market. The July high is the line I am watching. Until the index clears it, I would treat this as an ongoing consolidation inside a healthy uptrend, which is a perfectly normal thing to see after a run this strong.
Timely Tax Tidbits
The Fourth Quarter Belongs to the Prepared
September is when the tax year stops being theoretical. You can finally see most of your income, and you still have time to do something about it. Here is the one move worth looking at now, while there is still room to act on it.
If you are retired but not yet taking Social Security or Required Minimum Distributions, you may be standing in the lowest-tax window you will ever have, and it will not stay open.

This is the season to look hard at a Roth conversion. By September you can estimate the year’s income closely enough to fill up a tax bracket deliberately without spilling into the next one. One caution that catches people by surprise. A conversion raises your income for the year, and Medicare premiums look back two years, so a conversion in 2026 can raise your Part B and Part D premiums in 2028. That is not a reason to skip it. It is a reason to size it on purpose rather than by accident.
And a calendar note. Third-quarter estimated tax payments are due September 15. If you are self-employed, newly retired, or living partly on investment income, a five-minute check on your payments and withholding now can spare you an underpayment penalty next April.
This is general information, not tax advice, and every situation is different. Please talk it through with your tax professional before acting. I am always glad to be part of that conversation.
One more note before I go. In about two weeks I will send a short, separate letter on Medicare open enrollment. If you are on Medicare, watch your mailbox this month for your plan’s Annual Notice of Change and please do not throw it away. I will walk through what to look for and one trap that catches people every year. If you know someone turning 65, forward it to them.

Through faith-based guidance, we help your review and refine your strategies, ensuring preparation for your children’s education will build lasting legacies, honor God, and secure financial peace for future generations.
We’re committed to helping you experience financial contentment and peace through a plan that’s right for you and aligns your investments with your Christian values. It’s about understanding how you want to live and what you want to do. Whether you want to spend time with family or volunteer to make the world a better place, we help you prepare to spend your time, talents, and resources on what matters most to you.
Implementing faith-based investing begins just like any other investment management process – we’re looking for great investments!
“Give a portion to seven, or even to eight, for you know not what disaster may happen on earth.” — Ecc 11:2
Contact Us for a Free Consultation
